The Sieve of Eratosthenes Benchmark is a multiplatform tool intended to measure single-core integer performance of old CPUs. We measured hundreds of results and the program was compiled for many operating systems (DOS, AmigaOS, Mac OS, Solaris, HP-UX, IRIX, Windows CE, RISC OS…) and CPU architectures (x86, 68k, 6502, PA-RISC, SPARC, MIPS, ARM, PowerPC, Itanium…).
The goal of this benchmark is to measure relative performance of historic CPUs from the dawn of computing up until recently, when vector units, multiple cores and graphics and tensor accelerators took over, making a single core integer performance of less importance.
As any benchmark, it is far from being objective and it only measures the performance in a specific task, the sieve of Eratosthenes, in our case. Still, it is better than nothing and we believe that we have chosen a good compromise between simplicity of implementation and integer performance relevance. So, the outcomes of this benchmark should correlate with the CPU’s single core performance in compiling, graph algorithms, automated theorem proving, database searches, text processing, lossless data compression and similar integer tasks that are uneasy to vectorize. On the other hand, the performance of things like computer graphics, physics simulations or even as simple thing as block memory moves would rather be unrelated to the outcomes of this benchmark since they vastly benefit from the presence of special CPU units that cannot be easily employed in the sieve task.
Specifically, we chose it as a benchmark because
- It scales with the CPU addressing capability – if an average execution time of a single iteration of the inner loop is measured, we could in principle compare 8-bit machine computing primes up to 10000 with a 64-bit machine computing primes up to 10^11.
- Exercises loads, stores, bit manipulations and (to some extent) branching – this is what you’d expect from an integer CPU. At the same time, CPUs with wider than 8-bit data paths cannot benefit much from them, which is fair to 8-bit machines. Note that the performance ratio of, say, a 32-bit CPU to an 8-bit machine (as given by this benchmark) would be a lower bound on the 32-bit CPU speedup in most practical applications.
- Does not require multiplication so it does not penalize old machines that only had add and shift instructions. Unlike other benchmarks, this one does not output a single number but rather a table of execution times for different memory footprints. This allows for realistic testing of 8-bit machines with limited memory as well as modern machines with many gigabytes of memory. It is also revealing an interesting effect of CPU caches. It often happens that the CPU A seems to be faster than the CPU B for some array sizes while the opposite is true for others.
Also, we wanted to get maximum out of each architecture. That’s why there is a hand-tuned assembly for many platforms there. Quite a great care was devoted to its coding. This allows us to compare CPUs directly with more confidence, irrespective of the compiler used (but we also tested several compilers and BASIC interpreters just to see the big picture – in the 80s, they evolved at a similar pace as the CPUs themselves did).
Download
There is no dedicated page for this benchmark yet. However, you can download the whole project folder. It includes the source code, documentation, binary/symbol files for multiple CPU architectures and all results.
Check the README, KEY_to_FILES and KEY_to_RESULTS text files for more information. The README file contains important information for those who would like to write an Assembly benchmark implementation for their favorite CPUs (so that the results would be comparable).
Results
The results can be plotted using bash scripts in the /RESULTS directory (you should have gv and gnuplot installed in your computer). The most useful are “plot” and “speedup”.
Examples:
#1> ./speedup 386DX-QBASIC-20MHz 386DX-cQBASIC-20MHz 386DX-Borland-i86-20MHz 386DX-Borland-i386-20MHz 386DX-HC386-20MHz 386DX-386asm-20MHz
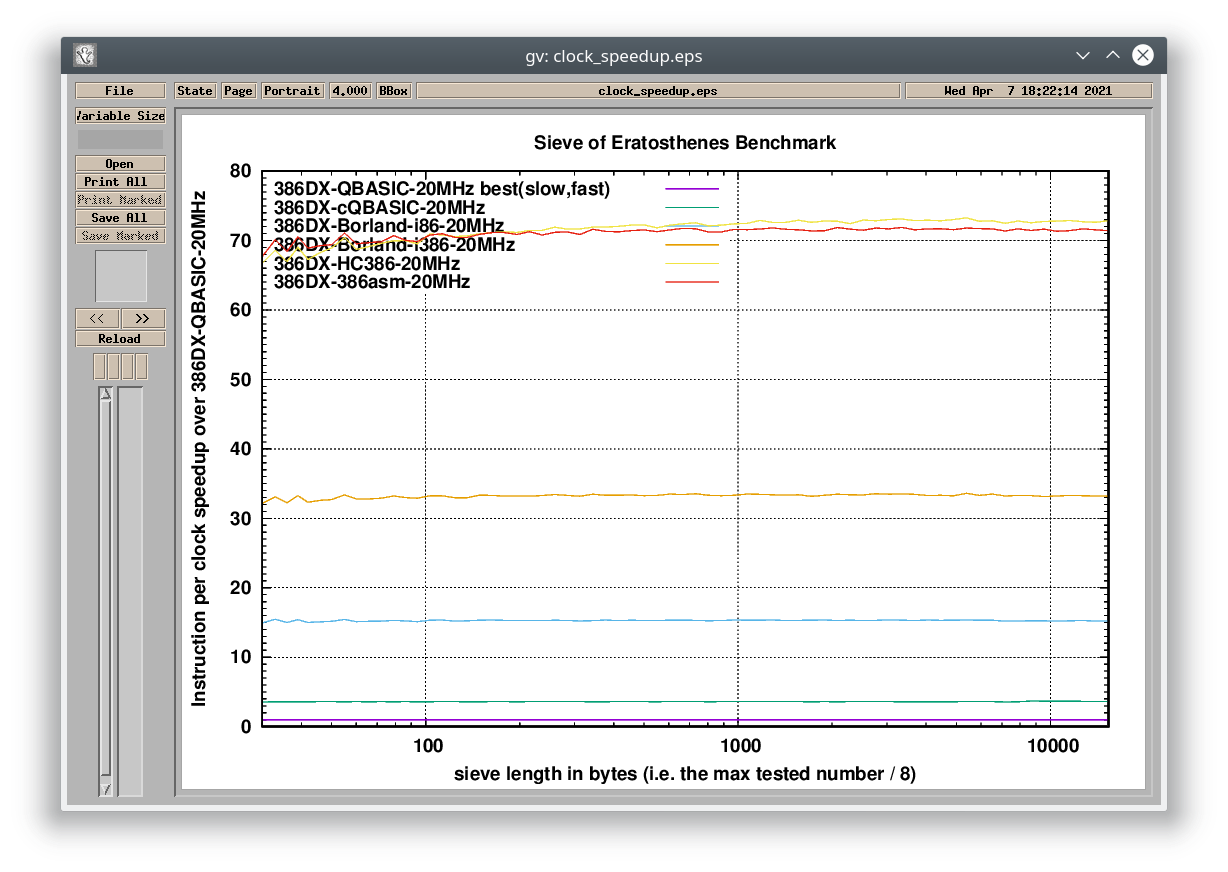
This is a comparison of multiple x86 implementations running on a 20-MHz i386 (IBM PS/2 Model P70). The graph shows relative performance to the result that is added as the first argument behind the script name (386DX-QBASIC-20MHz). The interpreted BASIC version runs 70 times slower than the C++ version compiled by the 32-bit Metaware HighC compiler.
- Compiled QuickBasic = 3x
- Borland C++ (8086 instructions) = 15x
- Borland C++ (386 instructions) = 33x
- Hand-tuned Assembly (386 protected mode) = 70x
- Metaware High C/C++ (386 protected mode) = 70x
#2> ./plot 486DX4-NanTan-386asm-100MHz Pentium_MMX-133MHz Pentium-II-366MHz Hitachi_SH3-133MHz StrongARM-206MHz MIPS-R5000SC-512kL2-MIPSpro32-180MHz PA-RISC-7200-aCC-O4-100MHz
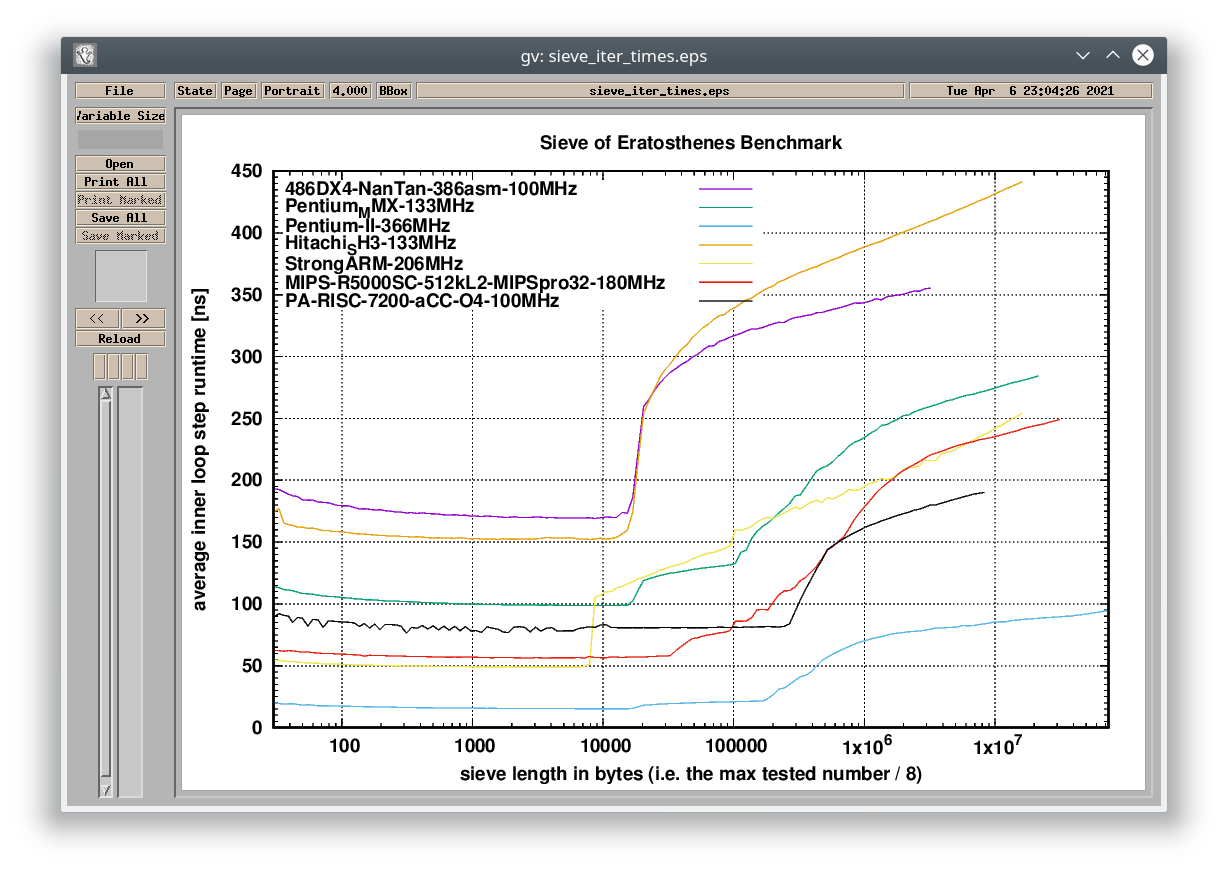
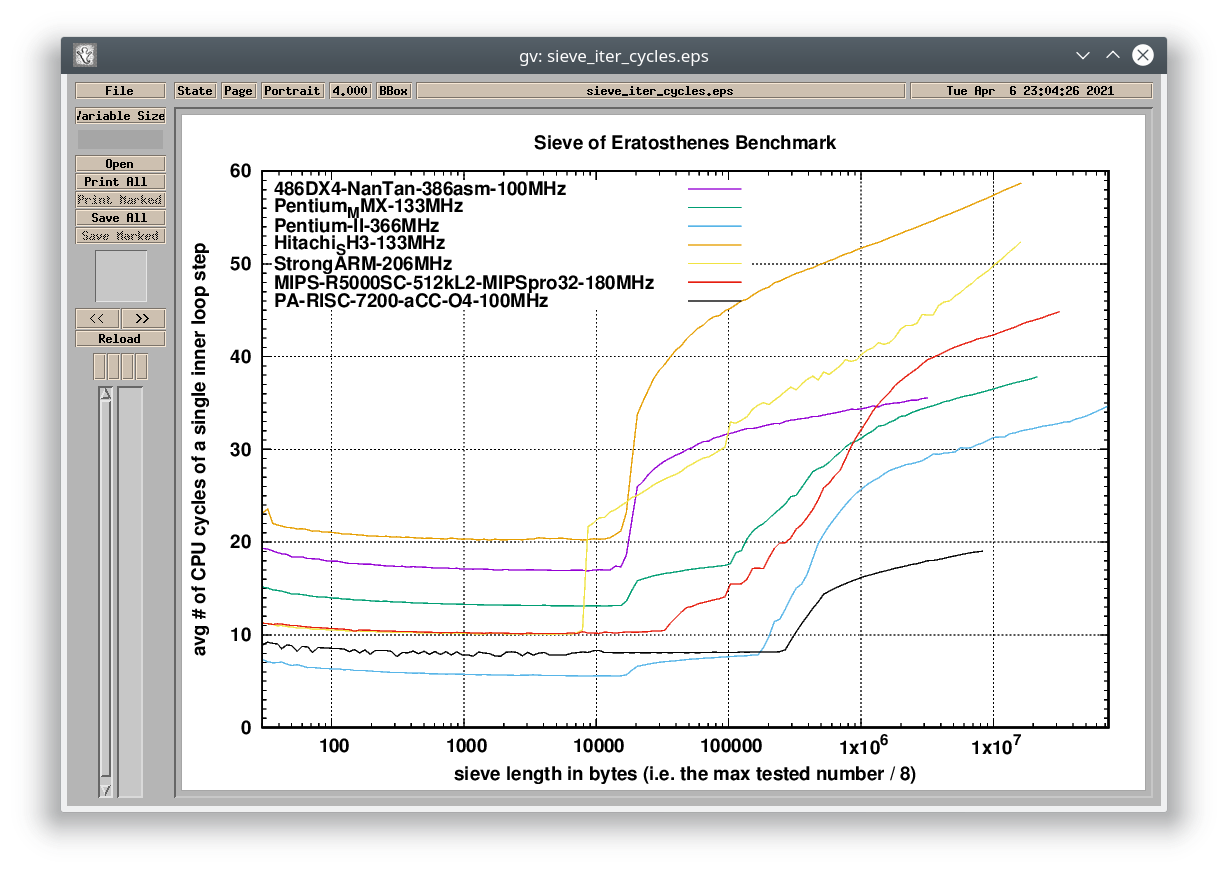
The plot script creates two graphs – one compares the results based on the absolute time required to go through the inner loop step. The other compares the results based on the CPU cycles required to go through the inner loop step, so it removes the difference caused by the frequency the CPUs are running at. The bumps in the results are the effect of the increasing dataset size (sieve length) not fitting into each level of cache (the number of bumps tells you how many levels of cache the system has).
You can see in the graphs, that non-x86 CPUs like Intel StrongARM, MIPS R5000 and PA-RISC 7200 are more efficient in integer operations (per clock) than the Pentium MMX, even though all of them are still just in-order architectures (unlike the Pentium II which is out-of-order). Note that the 206MHz StrongARM was benchmarked in an HP Jornada 720 battery-operated Windows CE handheld – the overall lower speed of the device was caused mainly by the slow power-efficient RAM and the absence of any L2 cache. However, if data can fit withing its L1 cache, the CPU is surprisingly fast.
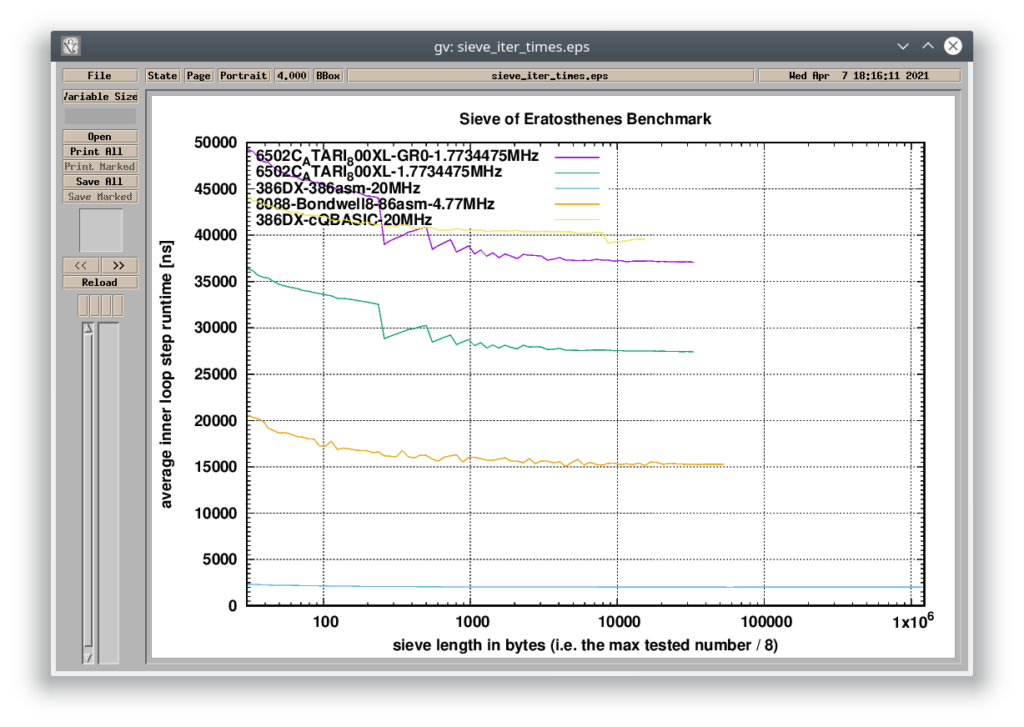
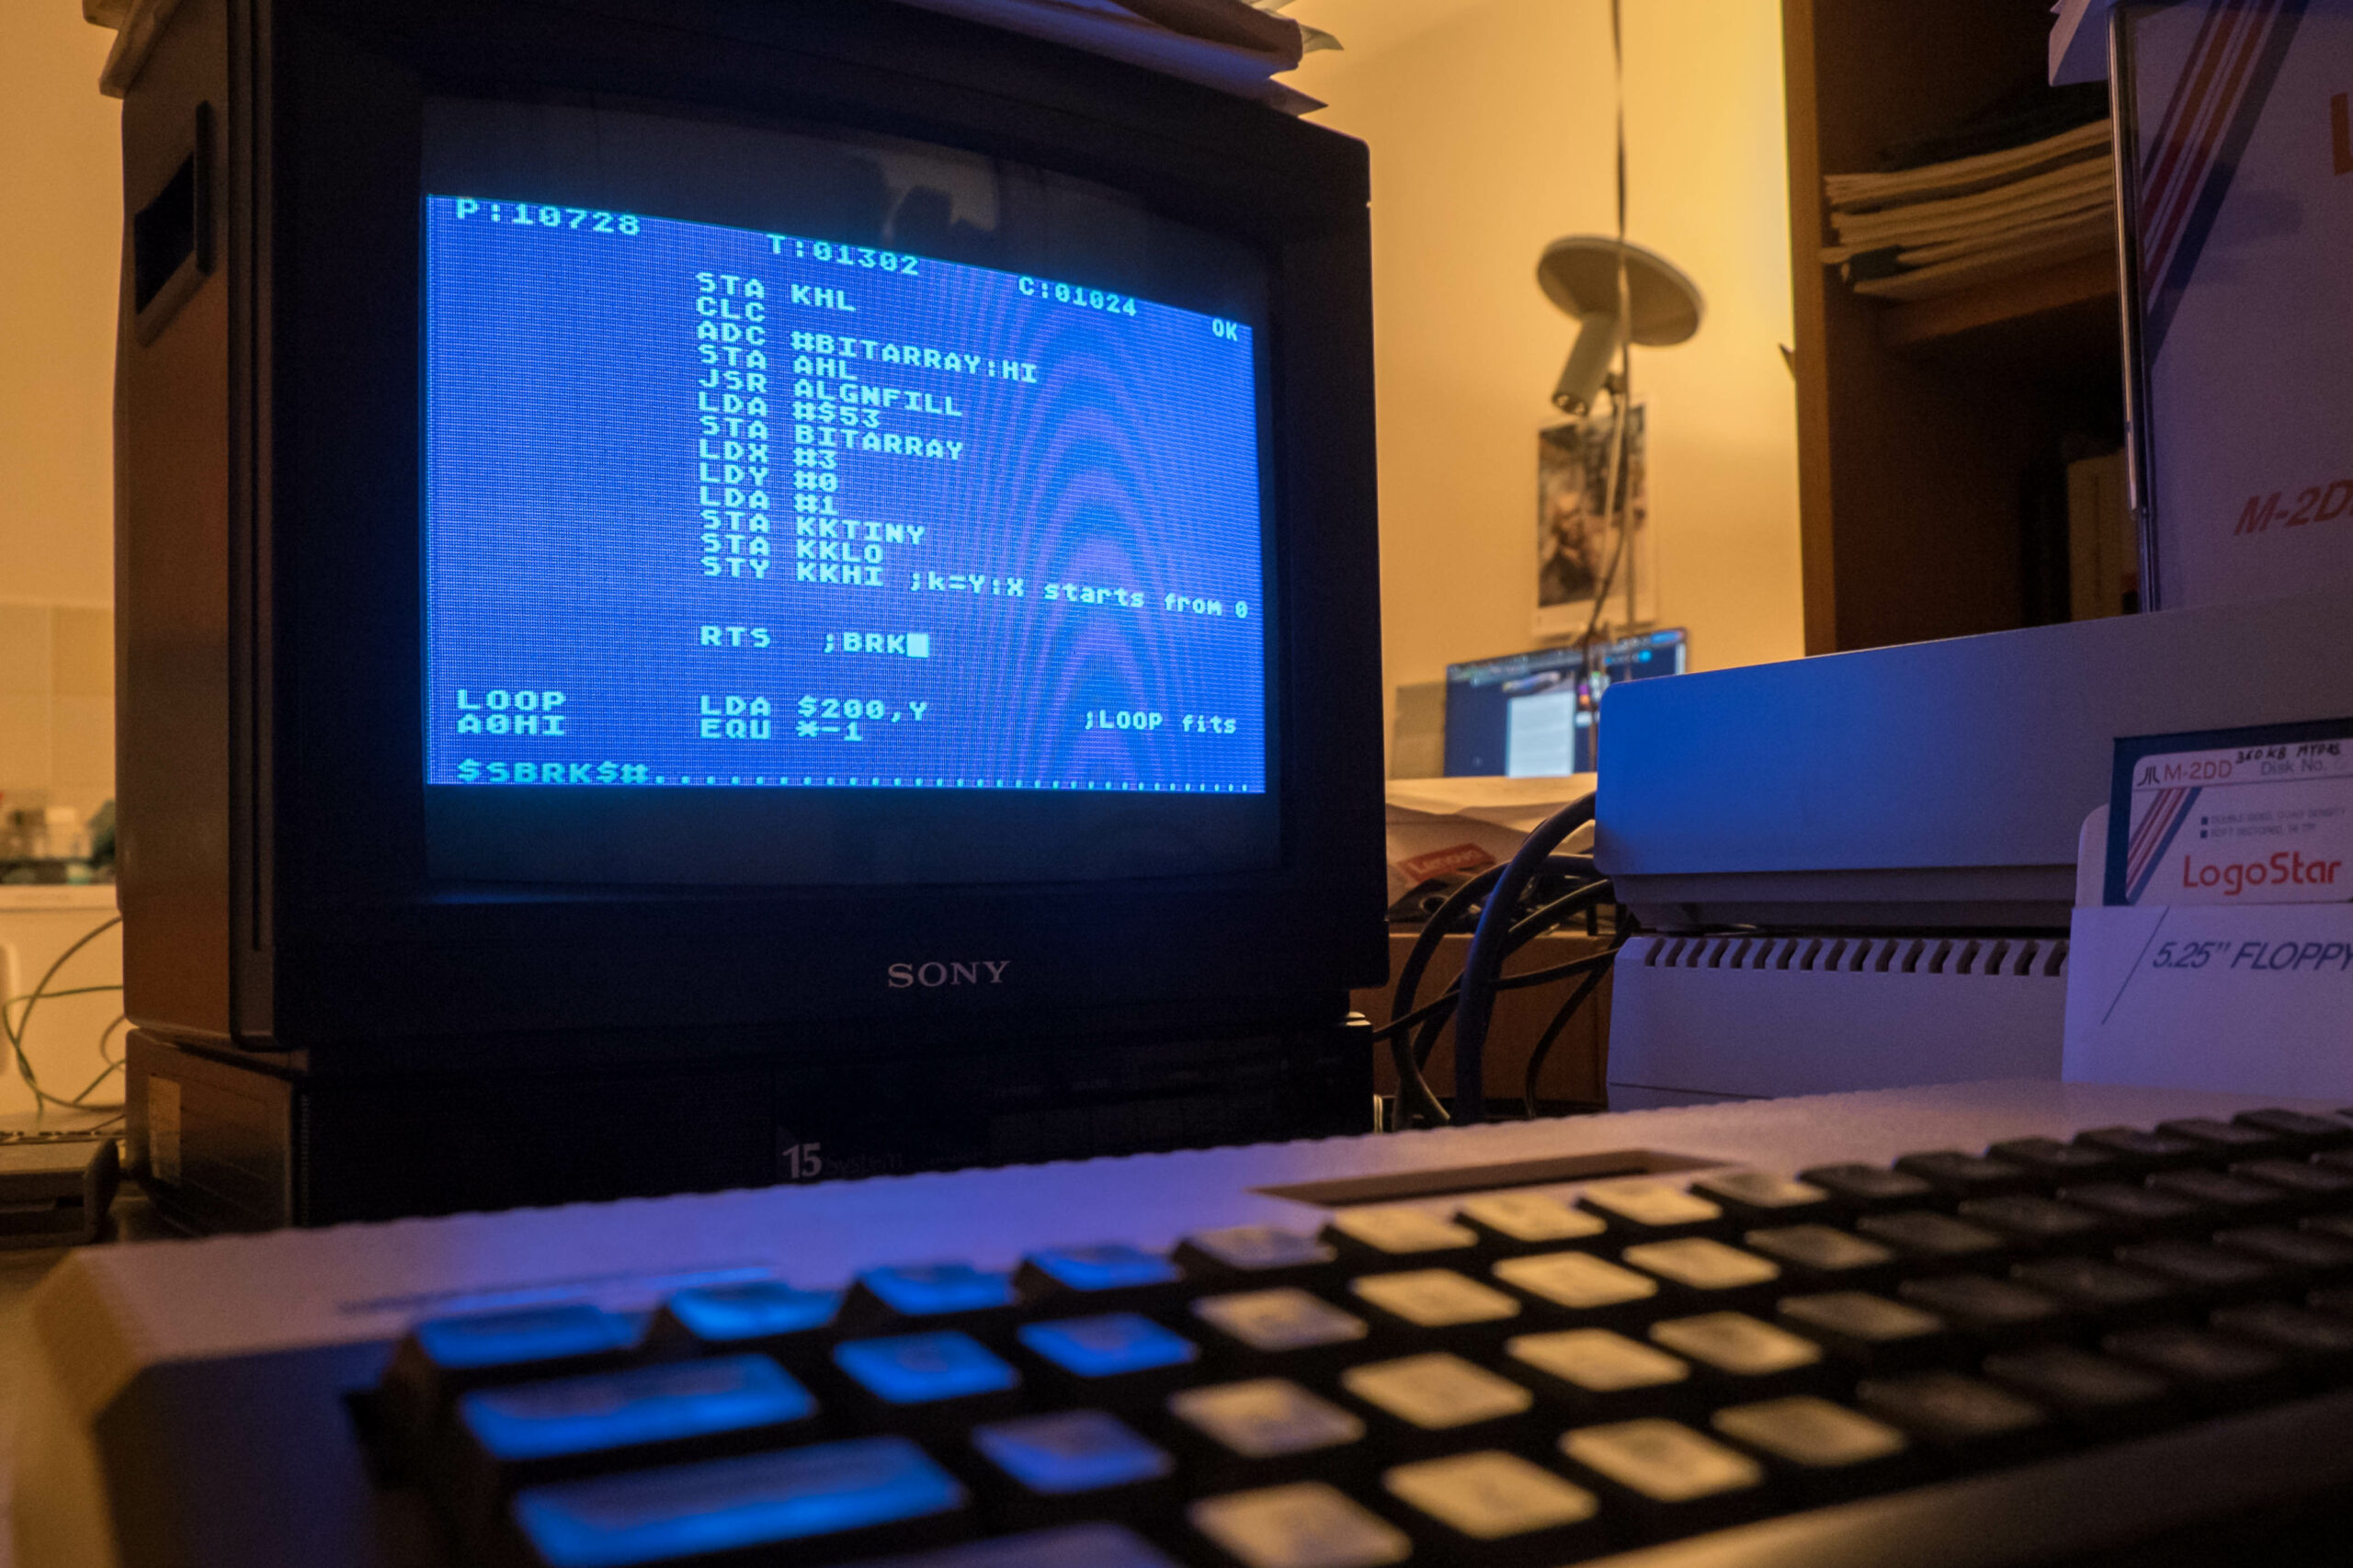
#3> ./plot 6502C_ATARI_800XL-GR0-1.7734475MHz 6502C_ATARI_800XL-1.7734475MHz 386DX-386asm-20MHz 8088-Bondwell8-86asm-4.77MHz 386DX-cQBASIC-20MHz
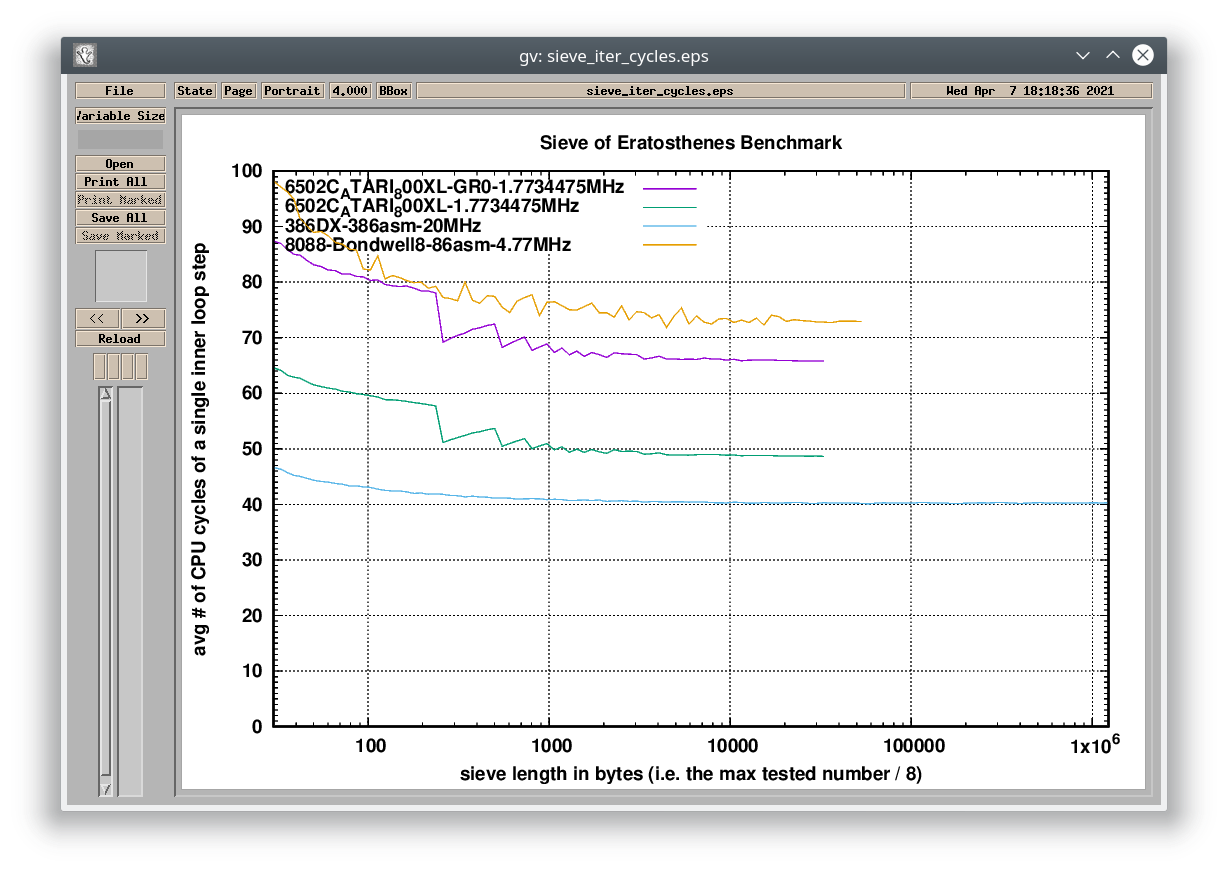
This example compares a 6502-based machine with the original IBM PC (Intel 8088). The graph above shows the “per-cycle” efficiency of these CPUs together with a 20MHz 386DX. The 6502 and the 16-bit x86 implementations work withing 64KB boundary (both written in Assembly and heavily hand-tuned to get the best performance – more about it on my Tumblr). The 386 implementation runs in the 32-bit protected mode and it is not affected by the segment-offset clutter.
The 6502 implementation was tested on an Atari 800XL PAL machine. The CPU performance is affected by a graphics chip sharing the system memory. The result called “GR0” was measured when the system was switched in the hi-res text mode. The other one is measured when the screen output was disabled. The IBM PC requires 73 CPU cycles to go through the inner loop step. The Atari 800XE requires 66 CPU cycles in the text mode or just 49 CPU cycles when the video circuit is not working, so the 6502 is clearly a more efficient processor (“per-cycle”). On the other side, the PC is clocked 2.7x higher than the Atari (and 4.7 higher than Commodore 64 or Apple II), so no – these 8-bit systems do not have a faster CPU than the original IBM PC. You can create a pathological case where 6502 is faster, but the real-world performance is in favor of the Intel 8088 CPU.
The graph below shows the comparison in absolute time. I also added a 20MHz 386 running the test in a compiled MS QuickBasic implementation. The compiled BASIC program provides the same performance on this 386 as the heavily optimized Assembly program for the 8-bit Atari. That says a lot.